Como citar
Felix Morel AD, Mañón Guzmán LA, Ramírez Comas AA, Bueno Espinal D, Morla Báez E. Target height in university students. ADOPA. 4(1):E41002. Disponible en: https://adopa.pediatriadominicana.org/index.php/adopa/article/view/96
ADOPA, Vol. 4, No. 1, enero-abril, 2026 • ISSN (en línea): 2960-7582 • Sitio web: https://adopa.pediatriadominicana.org/index.php/adopa
Felix Morel AD, Mañón Guzmán LA, Ramírez Comas AA, Bueno Espinal D, Morla Báez E. Target height in university students. ADOPA. 4(1):E41002. Disponible en: https://adopa.pediatriadominicana.org/index.php/adopa/article/view/96
Introduction: Determining the target height or genetic height is a common reason for consultation with a pediatric endocrinology specialist. Both parents and children often seek to predict what their adult height will be, particularly when discrepancies are observed relative to same-sex peers in their social environment. While height is influenced by both genetic and environmental factors, families seek consultation on the feasibility of increasing stature beyond genetically determined limits.
Objective: To evaluate the association between the final height of adult university students and the height of their parents, in order to estimate the genetic influence on longitudinal growth.
Materials and Methods: During the period June–December 2025, the target heights of 77 university students were analyzed: 49 females and 28 males, with mean ages of 21.88 ± 1.60 years for females and 22.60 ± 1.55 years for males. The method proposed by Tanner, based on mid-parental height with sex-specific adjustments, was used. Student’s height was compared with their parent’s height, and their positions relative to the final target height. For statistical analysis, Pearson’s chi-squared test was applied (α = 0.05).
Results: The mean height of males was 177.50 ± 8.22 cm compared with 162.88 ± 6.82 cm for females. The mean maternal height for male students was 165.46 ± 6.53 cm and 161.62 ± 5.69 cm for female students. The mean paternal height was 176.21 ± 8.21 cm for males and 175.63 ± 7.58 cm for females. Fifty-seven percent of males exceeded paternal height, and 44.89% of females exceeded maternal height (p < 0.05).
Fifty percent (14/28) of males reached the expected target height, 17.85% (5/28) fell below it, and 32.14% (9/28) exceeded it. Among females, 73.46% (36/49) reached the target height, 14.28% (7/49) fell below it, and 12.24% (6/49) exceeded it (p < 0.05).
Of the 14 males who reached the target height, 11 (78.57%) were within mean ± 2 SD, and 3 (21.42%) were between mean −2 SD. Among the 36 females who reached the target height, 16 (44.44%) were within mean ± 2 SD, and 20 (55.55%) were between mean −2 SD (p < 0.05). Males who reached the target height tended to be located above the mean, whereas females were generally between the mean and −2 SD.
Conclusions: 57% of the Male students-paternal height/ female students-maternal height, and 50% reached the estimated target height. In the case of the girls, 44.89% exceeded their mother’s height. However, when the father’s height was incorporated into the Tanner equation, 73.46% of the girls reached the expected target height.
These results demonstrate a significant influence of the paternal genetic component on final height, which is reflected in the Tanner formula. The observed difference was statistically significant (p < 0.05).
Introducción: la determinación de la talla diana o talla genética es una causa común de consulta al especialista en endocrinología pediátrica. Tanto los padres como los jóvenes desean saber cuál será su estatura final cuando observan diferencias con los pares del mismo sexo en su medio social. Aunque la estatura es la resultante de factores genéticos y externos se preguntan si la misma puede ser mejorada.
Objetivo: evaluar la asociación entre la estatura final de estudiantes universitarios adultos y la talla de sus progenitores, con el fin de estimar la influencia genética en el crecimiento longitudinal.
Material y métodos: durante el período junio-diciembre del año 2025 realizamos un estudio observacional, analítico y transversal donde analizamos, mediante el método propuesto por Tanner a partir de la talla media parental y con variaciones según el sexo, la talla diana de 77 estudiantes universitarios: 49 femeninas y 28 masculinos, cuyas edades promedio fueron: para las hembras, de 21.88 ± 1.60 años y para los varones, de 22.60 ± 1.55 años. Se distribuyeron las estaturas de los estudiantes en relación con la de sus padres y a su localización en la talla diana final. Para el análisis estadístico se aplicó la prueba de X2 de Pearlson (alfa= 0.05).
Resultados: la estatura promedio de los varones fue de 177.50 ± 8.22 cm en comparación con 162.88 ± 6.82 cm para las hembras. La estatura promedio de las madres de los varones fue de 165.46 ± 6.53 cm y de 161.62 ± 5.69 cm de las hembras. La talla paterna promedio fue de 176.21 ± 8.21 cm para los varones y de 175.63 ± 7.58 cm. El 57 % de los varones superó la talla paterna y el 44.89 % de las hembras a sus madres.
El 50 % (14/28) de los varones finalizó en la talla diana esperada, 17.85 % (5/28) por debajo de esta y un 32.14 % (9/28) por encima de esta (p<0.05).
Para las hembras, 73.46 % (36/49) alcanzó la talla diana, 14.28 % (7/49) terminó por debajo de esta y 12.24 % (6/49) por encima de la misma (p<0.05).
De los 14 varones que alcanzaron la talla diana (50 %), en 11 (78.57 %) esta se localizó entre la media +2DE, y 3 casos (21.42 %) entre la media -2DE.
Mientras que de las 36 (73.46 %) hembras que alcanzaron la talla diana, 16 (44.44 %) se localizan entre la media +2DE y en 20 casos (55.55 %) entre la media -2DE. Los varones que alcanzan la talla diana se localizan entre la media +2DE, en tanto que las hembras entre la media y -2DE.
Conclusiones: El 57 % de los varones superó la talla paterna y el 50 % alcanzó la talla diana estimada. En el caso de las hembras, el 44,89 % superó la talla materna. No obstante, al incorporar la talla paterna en la ecuación de Tanner, el 73,46 % de las niñas alcanzó la talla diana esperada. Estos resultados evidencian una influencia significativa del componente genético paterno en la estatura final, lo cual se refleja en la fórmula de Tanner. La diferencia observada fue estadísticamente significativa (p < 0,05).
Children’s height is a common reason for consultation among parents and adolescents. They are often interested not only in their predicted adult height but also in potential ways to optimize growth.
The concept of target height, genetic height, or family target height (FTH) was popularized by the British pediatrician and endocrinologist James Tanner, who developed the most widely used formula to estimate a child’s final height based on parental height, adjusting the mean parental height according to the child’s sex. This serves only as a reference, as nutrition and other factors can modify final height1.
Determination of target or genetic height using Tanner’s method, which relies on parental height, is frequently employed in pediatric consultations and may also help evaluate whether therapeutic interventions can improve final stature.
Although height is strongly influenced by genetics, environmental factors are critical for the full expression of genetic potential.
In addition to Tanner’s formula, several other methods are used to predict adult height, including the Greulich and Pyle2, Tanner-Whitehouse3 (TW3), Bayley-Pinneau (BP)4, Roche-Wainer-Thissen (RWT)5, BoneXpert6, and standard growth charts7.
The purpose of this study was to determine the target height in a sample of university students using the Tanner method, and to analyze the influence of parental height on it.
Between June and December 2025, an observational, analytical, and cross-sectional study was conducted to analyze target height in a sample of adult university students who had already completed their growth spurt, which is reached at 16 years of age in females and at 18 years of age for males. Seventyseven university students participated, of whom 49 were females and 28 were males. The mean age was 21.88 ± 1.60 years for women and 22.60 ± 1.55 years for men Height data for students and their parents were self-reported.
Target height was calculated using the Tanner formula:
An interval of ±5 cm was added to each calculation.
Student heights were compared with parental heights and categorized according to whether they fell within, above, or below the target height. For statistical analysis, Pearson’s chi-squared test was applied (α = 0.05).
The authors declare no conflicts of interest. All students provided informed consent for analysis and publication of their data.
The mean height of males was 177.50 ± 8.22 cm compared with 162.88 ± 6.82 cm for females. Mean maternal height was 165.46 ± 6.53 cm for males and 161.62 ± 5.69 cm for females. Mean paternal height was 176.21 ± 8.21 cm for males and 175.63 ± 7.58 cm for females (Table 1).
Table 1. Distribution of students height in relation to their parents height
| STUDENT | CASES | Height | MH | PH | >PH | <PH | >MH | <MH | H=PH | H=MH |
|---|---|---|---|---|---|---|---|---|---|---|
| MALE | 28 | 177.50±8.22 | 165.46±6.53 | 176.21±8.21 | 16 | 10 | 27 | 1 | 2 | 0 |
| FEMALE | 49 | 162.88±6.82 | 161.62±5.69 | 175.63±7.58 | 2 | 46 | 22 | 23 | 1 | 4 |
| MH = Maternal Height PH = Paternal Height | ||||||||||
Search: Morla et al., Target Height in University Students.
Table 2. Distribution of students in relation to their target height
| STUDENT | CASES | TH | <TH | >TH | THX+2DE | THX-2DE |
|---|---|---|---|---|---|---|
| MALE | 28 | 14 | 5 | 9 | 11 | 3 |
| FEMALE | 49 | 36 | 7 | 6 | 16 | 20 |
| TH = Target Height TDX = Target Height Media | ||||||
Search: Morla et al., Target Height in University Students.
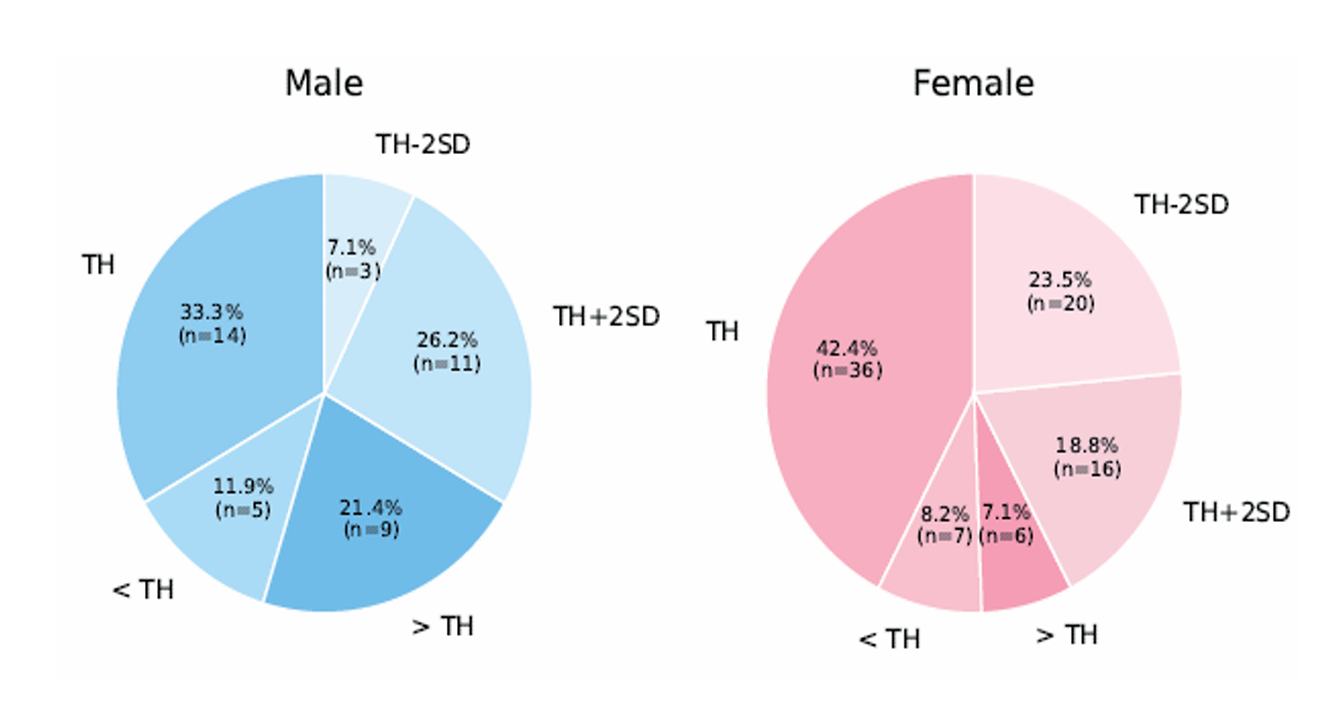
Figure 1. Distribution of students in relation to their target height
Search: Morla et al., Target Height in University Students.
When analyzing final height relative to paternal height, 57.14% of males exceeded their fathers, 35.71% fell below, and 7.14% equaled paternal height. Among females, only 4.08% exceeded paternal height, 93.87% were below, and 2.04% equaled it
(X² = 30.17; p < 0.05).
Relative to maternal height, 96.42% of males surpassed their mothers, and 3.57% were below, whereas 44.89% of females exceeded maternal height, 46.93% were below, and 8.16% equaled it (X² = 17.67; p < 0.05).
Fifty percent (14/28) of males reached the expected target height, 17.85% (5/28) fell below, and 32.14% (9/28) exceeded it (Table 2, Figure 1). Among females, 73.46% (36/49) reached target height, 14.28% (7/49) fell below, and 12.24% (6/49) exceeded it. Of the males who reached the target height, 78.57% (11/14) were within mean ± 2 SD, and 21.42% (3/14) were between mean −2 SD (X² = 4.31; p < 0.05). Among females, 44.44% (16/36) were within mean ± 2 SD, and 55.55% (20/36) were between mean −2 SD.
Evaluation of growth is a primary reason for pediatric endocrinology consultations. Although factors such as nutrition, endocrine disorders, and comorbidities can affect growth, parental height strongly influences adult stature.
Target height is widely used to assess whether a child is growing within the expected familial range8, with Tanner’s method being the most common. Other methods, such as TW39, parental height prediction10, BP11, and RWT11, utilize alternative parameters.
In this study, the final height of the male students and of their parents was greater than that of the females.
In this study, male students and their parents were taller than females. Men historically grow taller than women due to later onset of puberty, prolonged growth periods driven by testosterone, and delayed epiphyseal closure compared with women, whose growth plates close earlier under estrogen influence.
Genetic potential, nutrition, and living conditions affect final height. Approximately 80% of height is genetic, and 20% environmental. Over 700 genes regulate growth, including FGFR3, HMGA, and SHOX on the Y chromosome, which accounts for sex differences. Variants in ACAN, STC2, and the FGFR3MAPK-STAT pathway also influence epiphyseal growth12, 13.
The SHOX gene, located on both X and Y chromosomes, has been linked to final height. Research from Geisinger College of Health Sciences (Dr. Matthew Oetjens) suggests stronger expression of SHOX on the Y chromosome explains about one-quarter of the average height difference between sexes.
In this study, 46.93% of female students were shorter than their mothers. Inclusion of paternal height in the Tanner equation increased the proportion reaching expected target height to 73.46%, although many remained between mean and −2 SD. The interaction of genetics (Y chromosome, SHOX) and hormones (testosterone vs. estrogen) explains male height advantage, consistent with our findings. Tanner’s method provides a simple and practical tool for physicians and families14, 15.
Fifty-seven percent of males exceeded their father’s height, and 50% reached the target height. Among females, 44.89% exceeded maternal height; when paternal height is included in the Tanner equation, 73.46% reached the expected target height, reflecting the influence of the Y chromosome.